


How I Read Market Structure: A Beginner’s Guide to Price Action
Introduction
When I first started learning trading, I spent a lot of time looking at indicators and trying to find the perfect entry. Over time, I realized that I was making things more complicated than they needed to be.
For me, one of the most useful skills I developed was learning how to read price action and market structure.
I have been involved in crypto for several years, and I have also spent years studying and teaching price action. What helped me most was learning to first understand what the price itself was doing before looking for an entry.
In this guide, I want to show you the simple process I use when I look at a chart. This is not a strategy that guarantees profits. The goal is to help beginners understand the story that price is telling.
What Is Price Action?
Price action simply means studying the movement of price on a chart.
Instead of immediately adding many indicators, I start by asking a few basic questions:
- Is the market moving up, down, or sideways?
- Is price making higher highs and higher lows?
- Or is it making lower highs and lower lows?
- Where has price reacted strongly before?
- What would confirm my idea?
These questions may sound simple, but they can completely change the way you look at a chart.
Step 1: Start With Market Structure
The first thing I look at is the structure of the market.
There are four basic terms you should understand:
Higher High (HH) Price makes a new high above the previous high.
Higher Low (HL) Price pulls back but stays above the previous low.
Lower High (LH) Price moves up but fails to reach the previous high.
Lower Low (LL) Price falls below the previous low.
For example, if I see:
HH → HL → HH → HL → HH
I can see that buyers are generally controlling the market. This is a basic bullish structure.
On the other hand:
LL → LH → LL → LH → LL
shows a basic bearish structure.
This is one of the first things I check before thinking about an entry.
Step 2: Identify the Trend
Once I understand the structure, I try to determine the overall direction.
I usually keep this part very simple:
Higher highs + higher lows = bullish structure
Lower highs + lower lows = bearish structure
No clear structure = potentially ranging or choppy market
One mistake I see beginners make is trying to predict a reversal just because price has moved a lot.
For example, if a coin has been going up strongly, some traders immediately think, "It has gone too high, so it must go down."
I prefer to wait for the market to actually show me a change in structure instead of trying to predict it.
Step 3: Mark Important Areas
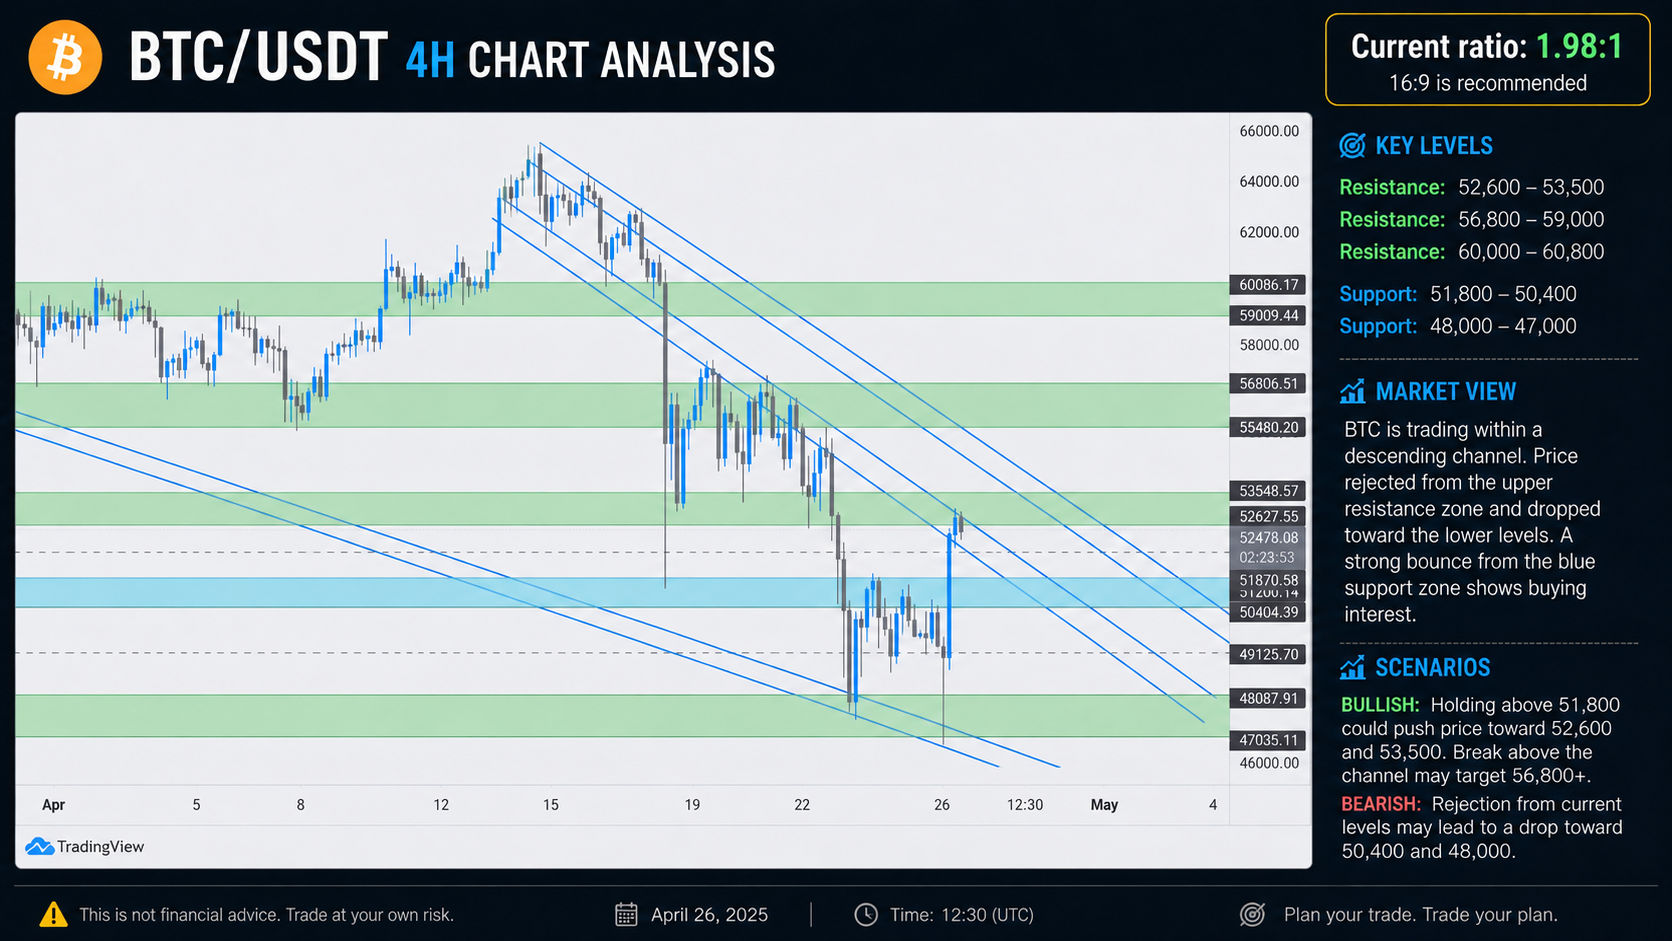
After identifying the structure, I look for areas where price has reacted before.
These can include:
- Previous highs
- Previous lows
- Strong support areas
- Strong resistance areas
- Areas where price moved away aggressively
I don't try to draw dozens of lines across the chart.
In my experience, too many levels can make the chart harder to read rather than easier.
I prefer to focus on the areas that have a clear reason to be important.
Step 4: Don't Enter Just Because Price Reaches Your Level
This is probably one of the most important lessons I learned.
Finding a support or resistance area doesn't automatically mean I should enter a trade.
I want to see how price behaves when it reaches that area.
For example, imagine price is moving down toward an important support zone.
Instead of immediately buying, I can wait and observe:
- Does price actually react?
- Does the bearish structure change?
- Does price create a higher low?
- Is there a clear rejection?
- Does the next candle or price movement confirm the idea?
The exact confirmation I use can depend on the market and timeframe, but the principle is the same:
I don't want to guess what price will do. I want price to give me some information first.
Step 5: Use Multiple Timeframes
Another habit that has helped me is looking at more than one timeframe.
I usually want to understand the bigger picture before focusing on a smaller timeframe.
For example, a simple process could be:
Higher timeframe → Market structure → Important area → Lower timeframe confirmation
A chart might look bearish on a 15-minute timeframe while the bigger trend is still bullish.
Without checking the larger picture, it is easy to misunderstand what is happening.
This doesn't mean you need to analyze ten different timeframes. Even comparing a higher timeframe with your trading timeframe can provide useful context.
A Simple Example
Imagine I open a chart and see that the market has been making:
HH → HL → HH → HL
So my initial view is bullish.
I then notice that price pulls back toward an area where it previously reacted.
Instead of buying immediately, I wait.
If price holds the area and starts creating another higher low, that gives me more information.
If price instead breaks the previous important low and the structure changes, my original bullish idea becomes weaker.
This is how I try to approach charts: first create a hypothesis, then let price confirm or invalidate it.
Common Mistakes Beginners Make
1. Using Too Many Indicators
Indicators can be useful, but adding more and more indicators doesn't automatically make analysis better.
Sometimes a clean chart makes the market easier to understand.
2. Predicting Instead of Reacting
One of the hardest habits to break is thinking:
"I think price will go up, so I'm going to buy."
A better question is:
"What would price need to show me before I consider buying?"
That small change in thinking can make your analysis much more structured.
3. Ignoring the Bigger Picture
A small timeframe can look very different from a larger timeframe.
Always try to understand the broader market structure before making a decision based on a small movement.
4. Treating Every Level as Important
Not every previous high or low is a major support or resistance level.
If everything on your chart is marked as important, eventually nothing is.
5. Forgetting Risk Management
Understanding price action doesn't remove risk.
Even a very good setup can fail.
That's why technical analysis should always be combined with proper risk management. Never risk money that you cannot afford to lose.
The Simple Process I Use
When I open a chart, I try not to make it complicated.
My basic checklist is:
1. What is the market structure?
2. Is the market bullish, bearish, or ranging?
3. Where are the important areas?
4. What happens when price reaches those areas?
5. Do I have confirmation?
6. Where is my invalidation point?
If I can't answer these questions clearly, I don't feel the need to force a trade.
Sometimes the best decision is simply to wait.
Tools You Can Use
You don't need expensive software to start learning price action.
I recommend starting with:
TradingView — for charting and practicing market structure.
A notebook or screenshot folder — to save your chart analysis and review your decisions later.
One thing that helped me personally was going back to old charts and asking myself what I could have recognized earlier. Reviewing your own analysis is a great way to improve.
Final Thoughts
Price action is not about predicting every move.
For me, it is about understanding what buyers and sellers are doing and making decisions based on the information available on the chart.
If you're completely new to this, don't try to learn everything at once. Start with HH, HL, LH, and LL. Then practice identifying market structure on historical charts.
Take screenshots, mark the structure, and explain to yourself why you think the market is bullish, bearish, or ranging.
The more charts you study, the more naturally these patterns start to become visible.
And most importantly, remember that good analysis doesn't mean being right every time. A good process is about having a clear idea, knowing what would prove you wrong, and managing your risk when the market doesn't behave as expected.




Latest comments
0